
According to the latest offical figures, the estimate of fatalities for 2022 is the highest level since 2009 - and an increase compared to the previous year.
Drink-driving collisions represents 17% of all deaths on the roads. This shows the number of incidents involving drink drivers is now at its highest level 15 years.
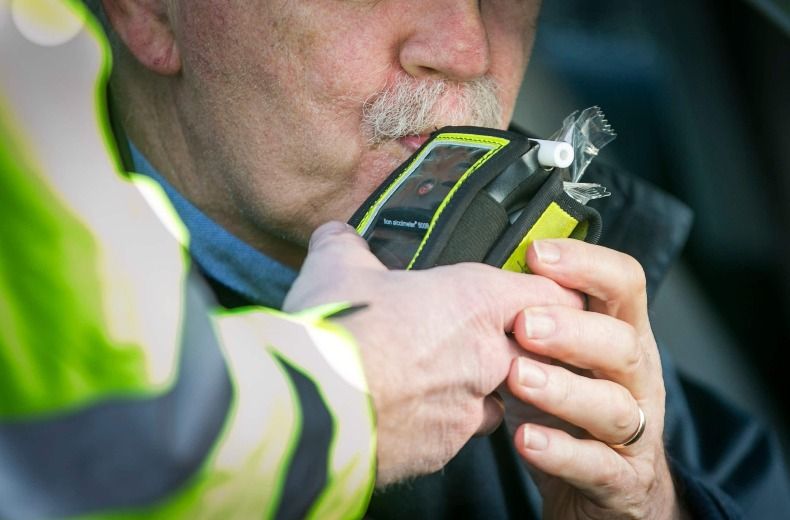
This guide looks at the statistics relating to drink driving in the UK.
Source: gov.co.uk
Drink-driving statistics
Overall, it's estimatated that 6,800 people were killed or injured when at least one driver was over the drink-drive limit in 2022.
This represents an increase of 1% from 6,740 in 2021.
This is the third lowest figure recorded since 1979.
The percentage of road casualties, whether fatalities, serious or slight injuries, that were drink-drive related has increased over the last 10 years, according to the latest 2022 data.
Following the release of the latest data in July 2024, RAC road safety spokesperson Rod Dennis said: "While the number of people killed by drink-drivers is still thankfully far lower now compared to the final decades of the 20th century, the fact we’re back to a similar rate of fatalities caused by people drinking and driving as we were in the late 1980s is abhorrent.
"It’s abundantly clear that a hard core of people, especially men, continue to put the lives of all road users at risk by choosing to get behind the wheel after consuming too much alcohol. This is the case across the UK, including in Scotland which has had a lower blood alcohol limit than in England and Wales since 2014.
"The UK might have an enviable record on road safety compared to many other countries, but there’s no getting away from the fact that overall casualty numbers aren’t really decreasing anymore. We urge the Government to work closely and collaboratively with experts to put in place a clear action plan for reducing these terrible statistics going forward. Every life lost on our roads is one too many.
"The data for Scotland suggests merely reducing the legal drink-drive limit isn’t enough. Drivers need to be prevented from being able to drink and drive in the first place, or at least believe there’s a very good chance of being caught. Data suggests a significant number of drink-drive offences are committed by reoffenders, so there’s a good case for fitting alcolocks which stop someone over the limit from starting a car. But there’s also a very strong argument for an increase in enforcement, something that will always be a challenge for as long as police resources are tight.
"We’re also pleased to see data on drug-driving is now being collected, as recommended by PACTS. Again, initial figures suggest the situation is getting worse but as the Department for Transport has noted there is more work to be done to ensure the data is as robust as possible."
Source: gov.co.uk
Drink-driving data by country
When looking at the casualties caused by drink drivers, there are differences between England, Wales, and Scotland.
The latest data shows that the percentage of all casualties which occurred in drink-drive collisions was the highest in Wales at 7.3%.
This was followed by England at 5.2% and Scotland at 4.1%.
Analysing the regions of Great Britain, the highest casualty rates was in the East Midlands (7%).
The lowest rate was in London at 2.5%.
However, when analysing the data, it is important to note that Scotland has a lower drink-drive limit compared to the other UK nations (22mg per 100ml of breath or 50ml per 100ml of blood in Scotland vs 35mg in England and Wales).
Drink-driving by gender
When it comes to collisions involving alcohol, the data shows that 79% involved male drivers. Female drivers represent 20% of the data, with less than 1% of recorded collisions where gender is not listed.
Overall road collision data highlighted that 70% of collisions involved male drivers, compared to 30% of collisions involving women.
Source: gov.co.uk
Drink driving by age
Looking at the ages for drivers who are responsible for drink-driving collisions, six-in-10 (64%) were aged between 25 and 59.
This was followed by 24% for ages 16 to 24, and 8% for those aged over 60.
Source: gov.co.uk
Is drink driving on the rise?
According to the annual RAC Report on Motoring, the number of people who admit to driving while over the drink-drive limit in 2023 was 7%.
This is the same proportion as in 2022 – but this is an increase from the 6% recorded in 2021.
However, these figures are lower than in both 2018 and 2019, where 19% of those surveyed admitted to drinking and driving for two years in a row.
The report suggests the pandemic and subsequent lockdowns have ‘resulted in permanent changes in attitudes to drink-driving’.
In the 2023 report, 20% of drivers admitted to being teetotal, and drivers under 25 are most likely to be non-drinkers (28%).
Of those who do drink alcohol, 56% never risk drinking and driving, either because they have a zero-alcohol policy when driving or because they do not drive to social functions.
A further third (33%) say they may drink at social occasions before driving home, but would have no more than one small drink – and would not drive while over the limit.
However, 13% say they would typically have at least one large alcoholic drink – such as a pint of beer or lager, or a large glass of wine or large measure of spirits – and then drive home.
Source: RAC (survey data of 2,937 drivers in 2023)
Drink driving in the UK by age
Those surveyed by the RAC were asked: ‘Thinking about times when you drive to go out with family, friends or for another social occasion where alcohol will be served, which of the following typically apply to you?’
Seventeen per cent of drivers aged 17-24 admit to having one small alcoholic beverage before driving at social events. This increases to 23% for those aged 65 and over.
Five per cent of younger drivers and 10% of those over 65 admit to having one large alcoholic drink at a social event before driving.
Concerningly, 3% of younger drivers admit to having two large alcoholic drinks – and 2% of older drivers – meaning that they are likely over the limit when behind the wheel.
According to the survey results, more younger drivers will decide to avoid any alcoholic beverage where they need to drive (24% vs 15%). 1And if they do, they will organise alternative transport options.
According to the RAC Report on Motoring 2023, drivers under the influence of alcohol or drugs is the biggest motoring concern for 15% of those surveyed.
Source: RAC
Drink driving collisions by month
In July 2024, the Government released its latest data on drink driving in the UK, and it highlighted the most likely months where collisions and casualties happen on the road network.
The table below shows that January, July, and August have the highest estimated collision rate, and July and August have the highest level of casualties.
| Collision month | Collisions | Casualties |
|---|---|---|
| January | 410 | 580 |
| Febraury | 340 | 490 |
| March | 350 | 490 |
| April | 360 | 550 |
| May | 390 | 610 |
| June | 430 | 630 |
| July | 410 | 630 |
| August | 410 | 590 |
| September | 390 | 600 |
| October | 370 | 530 |
| November | 380 | 540 |
| December | 380 | 550 |
| Total | 4620 | 6800 |
Figures are rounded to the nearest ten to reflect the uncertainty associated with making estimates from incomplete data sources. As a result, totals for a year may not match the sum of figures for all months due to rounding. Additionally, the data excludes pedal cyclists and horse riders.
Source: gov.co.uk
Drink driving collisions by time of day
The table below shows the reported drink-drive collisions by severity and time of event on the roads in Great Britain.
| Time of day | Fatal collisions | Total collisions |
|---|---|---|
| 00:00 - 00:59 | 20 | 370 |
| 01:00 - 01:59 | 20 | 270 |
| 02:00 - 02:59 | 10 | 180 |
| 03:00 - 03:59 | 20 | 180 |
| 04:00 - 04:59 | 20 | 150 |
| 05:00 - 05:59 | 10 | 100 |
| 06:00 - 06:59 | 10 | 90 |
| 07:00 - 07:59 | 10 | 90 |
| 08:00 - 08:59 | - | 70 |
| 09:00 - 09:59 | - | 90 |
| 10:00 - 10:59 | 10 | 90 |
| 11:00 - 11:59 | - | 70 |
| 12:00 - 12:59 | - | 80 |
| 13:00 - 13:59 | - | 90 |
| 14:00 - 14:59 | 10 | 130 |
| 15:00 - 15:59 | 10 | 160 |
| 16:00 - 16:59 | 10 | 160 |
| 17:00 - 17:59 | 10 | 270 |
| 18:00 - 18:59 | 10 | 260 |
| 19:00 - 19:59 | 10 | 290 |
| 20:00 - 20:59 | 10 | 300 |
| 21:00 - 21:59 | 30 | 340 |
| 22:00 - 22:59 | 30 | 400 |
| 23:00 - 23:59 | 20 | 420 |
| All hours | 280 | 4620 |
Please note that all figures in the table above are rounded to the nearest 10 and exclude collisions which only involve pedal cyclists or horse riders.
Source: gov.co.uk
Drink driving by country and English regions
This table shows the estimated number of reported drink drive collisions in Great Britain by country and English region according to the latest statistics from the Government released in 2024.
| Region or country | Fatal collisions | Total collisions |
|---|---|---|
| North East | 10 | 110 |
| North West | 30 | 450 |
| Yorkshire/Humberside | 20 | 410 |
| East Midlands | 30 | 520 |
| West Midlands | 30 | 300 |
| Eastern | 40 | 500 |
| South East | 50 | 940 |
| London | 20 | 520 |
| South West | 20 | 430 |
| England | 250 | 4190 |
| Wales | 10 | 230 |
| Scotland | 20 | 200 |
| Great Britain | 280 | 4620 |
Figures are rounded to the nearest ten to account for the uncertainty that comes with making estimates from incomplete data sources. As a result, totals may not sum precisely due to rounding.
Source: gov.co.uk

RAC sale – up to 33% off*
• Roadside cover from £5.29 a month†
• We get to most breakdowns in 60 mins or less
• Our patrols fix 4/5 breakdowns on the spot


